

Article
What is Cost of Sales? (And Why It’s Not the Same as COGS)
Cost of Sales and COGS aren't the same, and mixing them up hides costs and distorts margins. This covers what belongs where, and how to bring costs down.
Topic hub
Articles, videos, podcasts and webinars on Profitability for ecommerce brands.
Cost of Sales and COGS aren't the same, and mixing them up hides costs and distorts margins. This covers what belongs where, and how to bring costs down.

Tracking profit isn't the same as understanding it. This breaks down the four profit margins that fund overhead and growth, and why cash still runs out.

Shipping can eat up a quarter of ecommerce costs, so trimming it moves the needle on margins. This covers carrier rates, packaging, fees, and outsourcing.

Chasing growth alone can leave a business exposed. This shares five strategies LedgerGurus has seen work firsthand, from staying niche to getting COGS right.
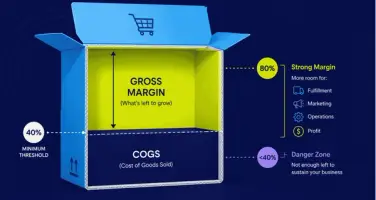
Knowing what counts as a healthy gross margin can make or break your business. This covers GAAP-correct definitions, benchmarks by model, and how to boost it.

A personal story about a botched shoe order makes the case that fulfillment and sales are directly linked, and what it means for inventory and loyalty.

Buy $100,000 of inventory in January, expense it all at once, and January shows a loss while February and March look spectacular. That works until you are running multiple suppliers, varying freight, and returns. Kelley Birrell explains why growth does not break your COGS, it exposes the method you were already using, and walks the accrual approach: inventory sits on the balance sheet as an asset and moves into COGS as it sells.

A $5 million business with healthy margins can flip to a loss on a 30% tariff increase, which is why blanket cuts are the wrong reflex. Kelley Birrell walks four steps: kill low impact spend, optimize fulfillment and marketing before slashing them, question fixed overhead including rent and payroll structure, then fix contribution margin at the product level. Plus three quick wins, including a bonded warehouse that delays your duty hit.

Slash marketing, drop your best tools, gut fulfillment, and then wonder why sales stalled. Kelley Birrell gives the benchmark ranges first, fulfillment at 10 to 15% of revenue, marketing 10 to 20%, payroll 10 to 15%, so you know whether you actually have a problem. Then the precision cuts: packaging dimensions, campaign audits, duplicate software, renegotiated 3PL terms, and two fast wins including a product redesign that doubles as a sustainability story.

LedgerGurus benchmarked its own monthly accounting clients and sorted them into four quadrants by growth and profitability. Stephen Brown and Stacy Walker walk through what separated the 44% that were growing and profitable: 66% gross margins, 7.5% of revenue on ads, and a wholesale channel in every top quartile brand. They also cover why the low ad spend surprised them, why cash balances track profit rather than growth, and the three levers that actually move profit.

Stacy Walker talks to eight to fifteen brands a week, and reckons only about one in five knows its true bottom line. On gross margin she puts it nearer one in ten. She and Stephen Brown walk through all four margins: what each one measures, why cost of goods sold gets stuffed with things that belong in cost of sales, and why pushing interest and tax below the line shows the real efficiency of the business. They close on which margin to fix first.

Between three and four and a half percent of ad spend goes to bot traffic, click farms, and clicks from outside your targeting geography, according to Dash.fi's data across a hundred clients. Kurt Bell tells Stephen Brown why Meta and Google have little incentive to fix it, why chasing refunds works less well than excluding bad IPs upfront, and how brands are diversifying away from the two big platforms. He also makes the case for card terms as an underused cash flow lever.

You track revenue but still wonder if your numbers are normal. LedgerGurus benchmarked around 90 of its own ecommerce clients: 44% are growing and profitable, median gross margin sits at 63.7%, and ad spend runs just 8.1% of revenue. Stephen Brown and Stacy Walker break down the four performance quadrants, why wholesale dilutes ad spend, which costs to attack first, and how to read a benchmark report without jumping to the wrong conclusions.

A 30% tariff turns a $400,000 profit into $178,000 before you do anything about it. Stephen Brown runs the Tariff Impact Calculator live, then lays out target ranges for every major cost category and works through where to cut. Discretionary spending goes first, payroll gets the three O's treatment, and the contribution margin triad of COGS, fulfillment, and advertising takes longer but moves the most.

A month after the global tariff announcement, most of the world sits at a 10% pause and China does not. Stephen Brown runs the numbers on what a 145% tariff does to an efficient brand, then works through the decisions in front of sellers: hold the order, use a bonded warehouse, or import at a loss. He covers how to game plan the rest of the world by trade balance, and how to spread the cost across manufacturers, customers, and wholesale prices.

Spending benchmarks and a quick-wins checklist to cut waste in software, ads, packaging, fulfillment, and payroll without stalling growth.

A free Excel budget for ecommerce that rolls sales by channel, COGS, expenses, and payroll into a monthly P&L with budget vs. actual tracking.

A checklist to prepare your ecommerce business for a sale: align owners, set up legal structure, clean up financials, and track the KPIs buyers want.


Thread’s old bookkeeper closed the books and stopped there. LedgerGurus closes them faster and helps the team understand what the numbers mean, through monthly P&L reviews, the Grow Dashboard, and advice from LedgerGurus’ COO.
“They'll not only close your books, but offer ecommerce insights that generic, or even high-end bookkeepers, aren’t equipped to provide.”: Thread
A product's underlying cost doesn't change based on where it's sold, but Amazon's Buy Box competition often pushes selling prices, and therefore margin, lower than the same product could earn on Shopify. Amazon-specific inbound fees like the Inbound Placement fee also add directly to COGS in ways a Shopify sale wouldn't, so tracking contribution margin by channel is the best way to see the real difference for your own products.
Read: Comparing margins across sales channelsAmazon's Buy Box competition often pushes selling prices, and therefore margin, lower than what the same product could earn on your own site. On top of that, Amazon-specific inbound fees like the Inbound Placement fee add directly to COGS, and a long list of other fees (fulfillment, storage, advertising) count as operating expenses rather than COGS under GAAP, all of which need to be tracked accurately to see true profitability.
Read: How Amazon fees shrink your marginContribution Margin = Sale Price − Variable Costs. Expressed as a ratio (contribution margin ÷ sale price), it makes it easier to compare products at very different price points, though profit velocity (contribution margin × sales volume) is what actually tells you which product drives more total profit.
Read: Find revenue opportunities by productWe use cookies to improve your experience and to measure how our site and ads perform.Read our Cookie Policy