
Estimated reading time: 9 mins
The Shopify sales tax report can be daunting at first glance. But in this post, we’re going to show you how to find it and break it down so you can understand it. This report will help you identify where you have or are approaching nexus, as well as how much sales tax you owe.
We’re going to cover:
- How to pull a detailed sales tax report on Shopify
- How to understand your report
- How to easily seeing where you have sales tax nexus and how much you owe
Where Do You Have Nexus?
Some questions we commonly get about Shopify sales tax from online sellers are:
- Do I need to collect sales tax on Shopify?
- Does Shopify automatically pay sales tax?
- Why is Shopify not collecting sales tax?
Shopify is a fantastic platform for ecommerce, but it is important to remember that it is NOT a marketplace facilitator, like Amazon, Etsy, eBay, and Walmart.
That means Shopify DOES NOT automatically collect sales tax for you, and it DOES NOT file and remit for you.
You also need to remember that you must register for a sales tax permit in a specific state BEFORE you can collect sales tax there. Each state has different economic thresholds, and you need to check regularly to see if you’ve crossed them. This is especially important now since states are becoming more aggressive towards online sellers as a result of a decrease in sales tax revenue from traditional brick-and-mortar stores.
What are these economic thresholds? We’ve done the research for you and recently updated our sales tax download. The appendix has a chart that will show you the economic thresholds state-by-state. The download also goes into a LOT of detail about economic nexus and how to register for sales tax permits. We tried to answer as many commonly asked sales tax questions as we could in it.

So, how do you know if you’ve crossed the thresholds? At the end of this blog post, we’re going to show you a handy trick to easily tell.
Further Reading: Economic Nexus by States for Sales Tax
How to Set Up Shopify Settings to Collect Sales Tax
After you know what states you have nexus in and you’ve registered for the permits, you need to configure your Shopify tax settings to collect sales tax from your customers.
After you’ve got it all set up, orders are coming in and sales tax is being collected. Now it’s time to file and remit.
How to Find Your Shopify Sales Tax Report
When you login to your Shopify account, you’ll be on your home screen. Follow these steps to get your sales tax report:
- Click on Orders in the upper left-hand corner. That’ll open a list of all your orders.
- Click on Export in the upper right-hand corner. This will open a pop-up screen that gives you the choice of how you want to view your orders. You may be doing quarterly filings or need to look at a whole year for a nexus analysis.
- To choose your timeframe, click on Orders by Date and choose the begin and end dates you want.
- Click on Export Orders and the file will be sent to the email address you have on file. It may take a while – up to a few hours – to get into your inbox, depending on how many orders you have.
After you’ve gotten the report in your email, download it and open it in Excel. This will look like a confusing pile of numbers, but we’ll show you how to sort it out.
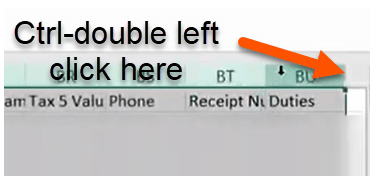
Cool Tip! Resize the table so you can see all the headers clearly.
How do you do that?
I’m so glad you asked. Select all the columns in the spreadsheet. Then click Ctrl–double left-click on the top right of the last column.
How to Read Your Shopify Sales Tax Report
Okay, now we’ll walk through the columns, so you know what you’re looking at. Many of them are self-explanatory, so we’ll focus on the most important ones.
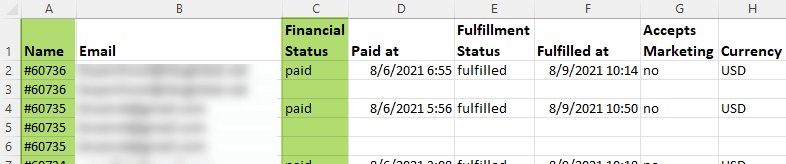
Name is the transaction ID number. It’s important to note here that you’re going to see duplicates. That is because every product a customer purchases creates a new line item within that order. So, if a customer purchases 5 items in the same order, they’ll all have the same transaction ID number but will be listed on 5 separate lines.
Financial Status shows where it was paid or not. This may seem like an unnecessary column, but if it’s unpaid, there was probably a problem with the payment method. You don’t have to remit sales tax for unpaid orders. We’ll talk more about this later.
The part we want to focus on most is columns I-N (the financial part).
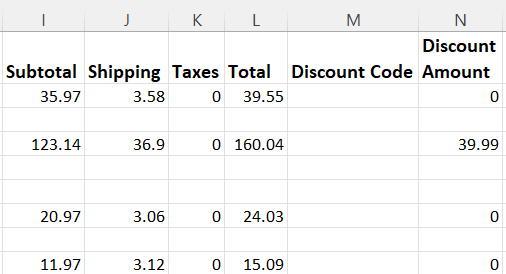
The Subtotal is what the customer ended up paying for the product. This is “net of discount,” meaning after the discount is already taken off the original price. You can see the Discount Amount in column N.
Subtotal – Discount Amount + Shipping + Taxes = Total.
Going to the right will show columns describing the items the customer bought. Other columns show info related to shipping and taxability. Then, there are a bunch of columns related to billing and shipping address information.
For sales tax purposes, we really want to focus on the shipping information.
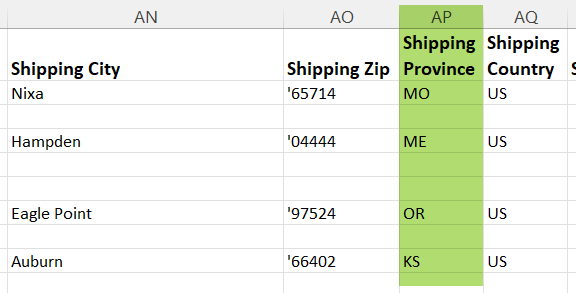
Column AP – Shipping Province is really important to pay attention to for nexus. FYI – Shopify calls it Shipping Province instead of Shipping State since other countries usually use the province terminology.
How to Use a Pivot Table to Remit Sales Tax Correctly
The easiest way to analyze this report is with a pivot table to quickly and easily summarize & organize the data.
I’m going to explain how to create a pivot table here, but if you’d rather watch Kexin, our sales tax guru, do it, watch Shopify Sales Tax Report | How to Find and Understand It. She starts explaining it at 7:16.
The first step is to add 4 columns at the beginning of the table so you can strip out the important information. Label the columns:
- A – Year
- B – Month
- C – Month Year
- D – Calculated Order Number (This will help you determine how many transactions you have in each state.)
After you’ve labeled your columns, you may want to highlight them a different color to differentiate them from the rest of the spreadsheet.
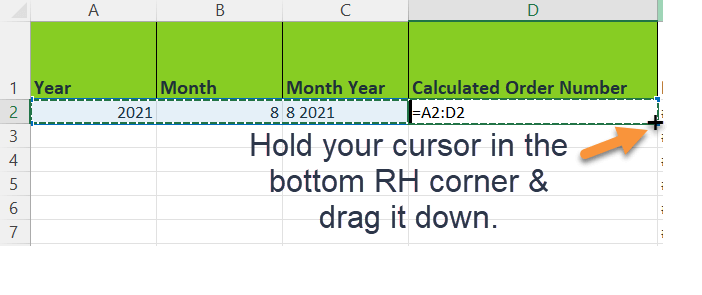
Then add these functions to the first row after the headings:
- A2 -> Type in =year(H2)
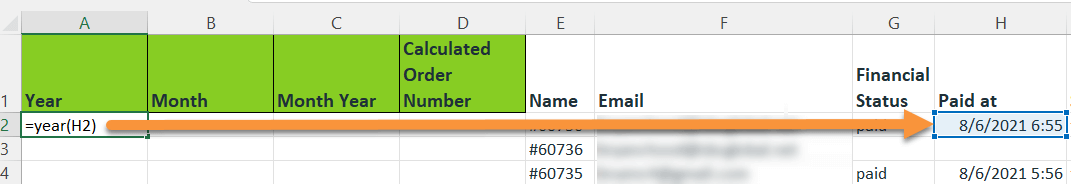
Don’t type H2. Click the box H2 to add to the function properly.
If you’re confused, H2 is the second row down in the column H, which is labeled Paid at. This is going to help you see exactly when this order was purchased, so you can get an accurate count for your sales tax filing.
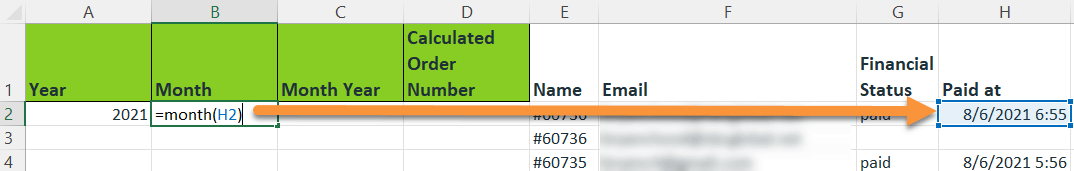
- B2 -> Type in =month (H2)
- C2 -> Type in =B2 & “ “ & A2
Make sure to add the space between the quotation marks so there is a space between the month and year in the data.
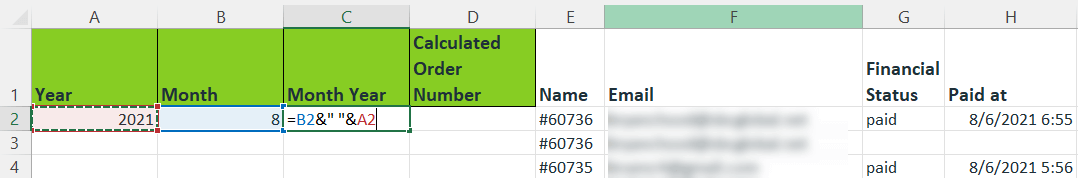
Again, click the actual boxes; don’t just type in B2 and A2.
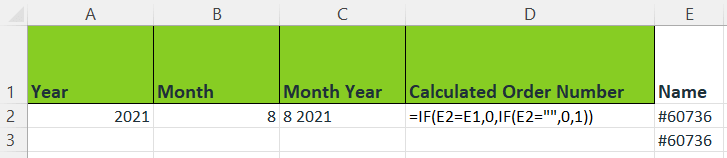
- D2 -> Type in =if(E2=E1,0, if(E2=””,0,1))
Don’t panic! This means that if the order number in a row is the same as the order number in the previous row, we don’t want it to count again. If not, we count the order. This takes into account all the duplicate transaction ID numbers.
When you’re finished the functions, select them all and drag them down to apply them to every order. All the rows should populate.
How to Create a Pivot Table
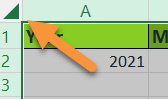
Okay, you’re all ready to create your pivot table. Click on the triangle in the top left-hand corner of the table. This will select the entire table.
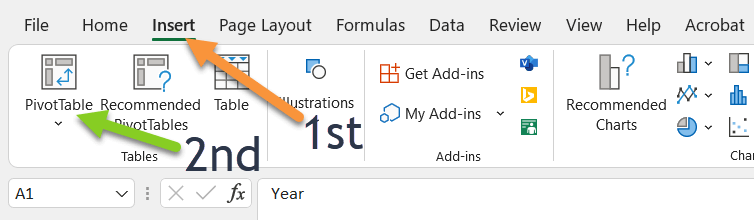
Then click Insert and then Pivot Table. It will pop up a box asking if you want to use the entire range you selected. Click OK.
A new screen is going to pop up. On the left is where the pivot table will appear. On the right, you’ll see all the columns from the spreadsheet listed.
You now get to decide how you want to set up the rows and columns and how you want to filter the information. To move columns into fields, just drag and drop from the list of columns or click the checkbox to the left. To find something quickly, type it into the search bar.
We suggest the following:
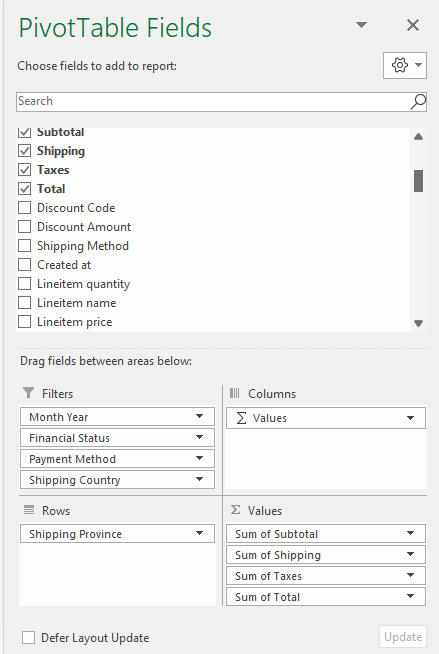
Filters (so you can manipulate the data to see only what you want to see):
- Month Year
- Financial Status
- Payment Method
- Shipping Country (so you can filter out non US-based transactions)
Rows
- Shipping Province (so you can see the information by state)
Values
- Subtotal
- Shipping
- Taxes
- Total
- Calculated Order Number
You can change the format to make them look cleaner, from this (messy):
To this (neat and tidy to look at):
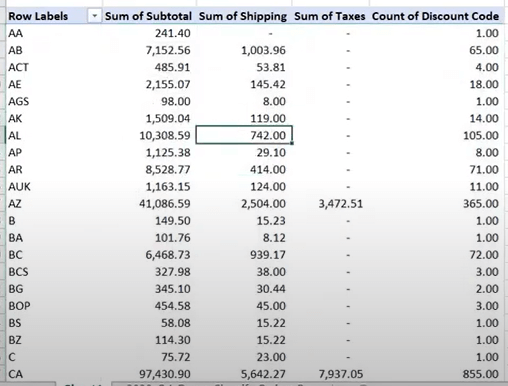
You do this by Selecting all except Sum of Calculated Order Number, clicking on Home, and then click on the big Comma under Numbers. This will make the numbers look neat and tidy.
(By the way, the column titled Count of Discount Code in the image was a mistake. You don’t need that one. That’s where Sum of Calculated Order Number will go.)
How to Filter Your Data Using the Pivot Table
Now that you’ve made a pivot table, you can filter it to get the information you need. You do this in the box in the top left corner.
- Click on Month Year so you can select the date range you want to analyze. (Ex. for Q4 of 2020, select 10 2020, 11 2020, and 12 2020). You’ll notice that an option is 1 1900. That’s not because any orders came during that time frame. It’s because that’s the default when a month and year are not listed. The order date is only listed once for each order. The rest of the boxes in that column, for that order, are blank. Unselect 1900.
- Click on Financial Status. This is where you filter out Pending because those orders didn’t go through.
- Click on Payment Method. Some of our clients want us to exclude manual orders. If you want that, too, Select All and then Unselect Manual.
- Click on Shipping Country. Select US to filter out international orders.
How to Summarize Data with Your Pivot Table
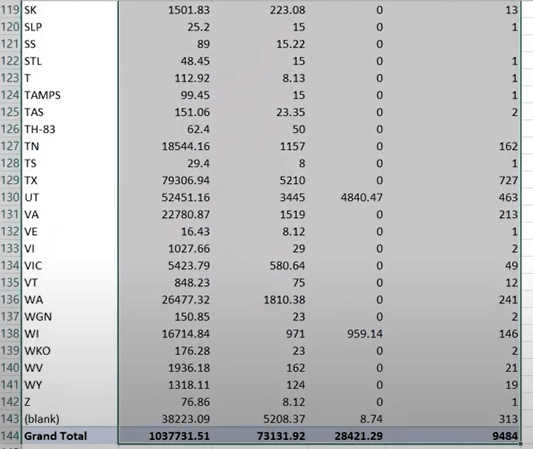
You are finally ready to summarize your detailed sales tax report data for determining nexus and filing sales tax.
Choose a state to start with. You’ll see the Subtotal of all the orders and Sum of Calculated Order Numbers in that state. Compare it to the chart of economic thresholds in the appendix of the sales tax download.
Remember that those are annual thresholds. So, if you’re analyzing for one quarter of the year, multiply by 4 to see if you’re getting close.
These thresholds are something you really need to pay attention to. Some states require you to register as soon as you cross it. Others give you some leeway. It’s important to know the difference. Why? Some states are getting pretty aggressive about sales tax for online sales. That detail for each state is also in the appendix of our download to help you protect yourself.
Note – Economic threshold for each state includes ALL the sales from ALL your channels. That means that you must add the info from all your channels for each state to determine nexus. This includes sales on marketplaces, like Amazon or Etsy, even if you don’t have to collect and remit sales tax on all of it.
Also, most states have requirements that look something like “$100,000 OR 200 transactions.” If you have less than $100,000, but over 200 transactions, you may still have nexus in that state.
Next, look at Sum of Taxes. If you see a number for that state, it is because you have determined you have nexus there and have turned-on sales tax collection for it. This is the amount you need to remit to the state’s Department of Revenue.
How LedgerGurus Can Help with Your Sales Tax
Understanding and sorting through the data in your Shopify sales tax report may seem like a serious headache. To be honest, it is. You may want to take our sales tax maturity assessment to get a clear picture of where you are with your sales tax compliance process. If you have questions and would like to talk to a sales tax guru, consider getting a sales tax consultation.
If you’re approaching $1 million in annual revenue, we can take over your sales tax headache. We have a whole team of sales tax gurus who are happy to do it for you!