Estimated reading time: 7 minutes
Let’s talk inventory forecasting! It’s one of those accounting topics that can seem a bit like guesswork, especially if you’re doing it without the aid of an inventory management tool. While it’s not the easiest job, it can be way simpler than you might expect.
In this post, we’ll cover inventory forecasting in Excel with our purpose-built template. Our intention is to help you effectively forecast your inventory planning and purchasing, even if you aren’t yet ready to invest in an IMS tool.
We can’t promise you’ll leave as an expert, but you should feel much more confident about your next steps!
Here’s what you’ll learn:
- Why inventory management matters
- How to use our inventory forecasting template
- How to get additional help with your inventory needs
A Quick Note About Our Inventory Forecasting Excel Template
This post links to our purpose-built inventory forecasting Excel template. It is essentially a 12-month sales forecasting Excel template, and we initially created it to use with our own ecommerce brand.
It’s important to mention that we don’t manage a staggering number of SKUs. If you stock hundreds or thousands of different products, this template will likely make you crazy – that’s simply too many products to handle in Excel.
Technically it’s possible, but you’d be better served by using specialized inventory management software when you’re operating with such a diverse stock of products. You might like to check out any of the following options for this:
Just so you know, a major piece of what we do here at LedgerGurus is to help clients find and implement inventory management tools that fit their business’s needs. We are familiar with several tools and can help you find the right one.
Click here to get our help finding and implementing an IMS tool.
Further reading: How to Choose Inventory Management Software
How Much Inventory Should I Have?
Inventory management matters.
Inventory overselling can be a real killer for ecommerce platforms. While there are a whole host of benefits to selling on sites like Shopify or Amazon, the intensity of the competition you’re facing is certainly nothing to sneeze at. If you run out of stock – and even worse, if you’re then dealing with a 4+ month lead time – your prospective customers will simply look elsewhere.
While we recommend inventory management software (IMS) when companies are ready for it, managing inventory in Excel can be a very viable method for companies that aren’t yet.
When asking yourself “How much inventory should I order?”, you should have the information you need ready to go. Otherwise, you’re really just guessing with no basis in reality, and you may struggle to maintain your edge online.
The ecommerce sales forecast template we discuss in this post not only makes forecasting inventory simpler, but it also helps you to make more accurate predictions about how much your orders will cost and when you should be placing them to get them into your warehouse in time.
The template is designed to handle small to medium inventories. When used correctly, it can:
- Enable you to make clearer predictions about order costs
- Provide a quick overview of your available and forecasted stock
- Help you keep stocks above empty forever!
Further reading: Causes of Stock Discrepancies | Why Your Inventory Count is Off
How to Use Our Inventory Forecasting Excel Template
Right, let’s get into it! Before we start, here’s the link to the free template:

Now, let’s explore the various components of the forecasting sheet.
Visual Learner?
Those who prefer a visual approach might like our video on this exact topic. It can watched below:
Step 1 – Prior Year Sales Data
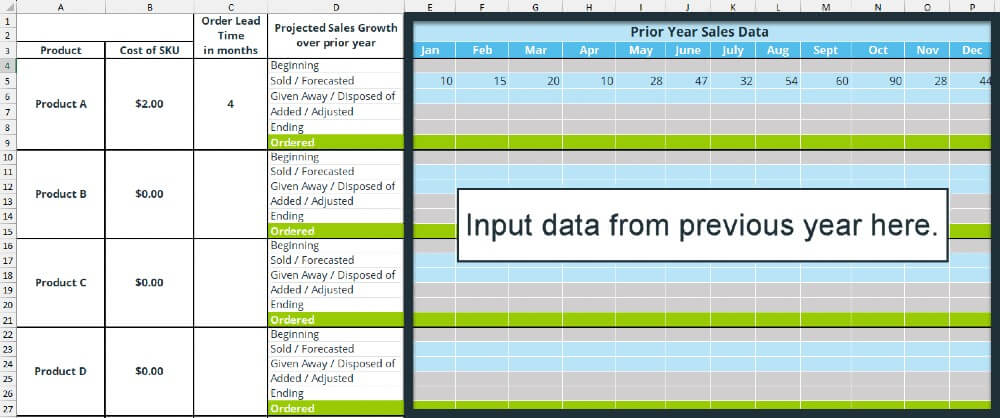
Before we get into the nitty-gritty of our inventory forecasting template, we want to bring up an important piece of information: PRIOR YEAR SALES DATA. This is what you’ll be using to build your own sales projection forecast.
Historical data is critical if this template is going to be of any use for you, and not just a shot in the dark.
You’ll essentially input the number of sales of a given product you made last year and use that data to make predictions about the year ahead. Be sure to have this information on hand before continuing.
Note: for the most accurate results, you may want to fill out this spreadsheet immediately after a full inventory check. Let’s say you run a full inventory in January; February would be a good time to get all your information inputted!
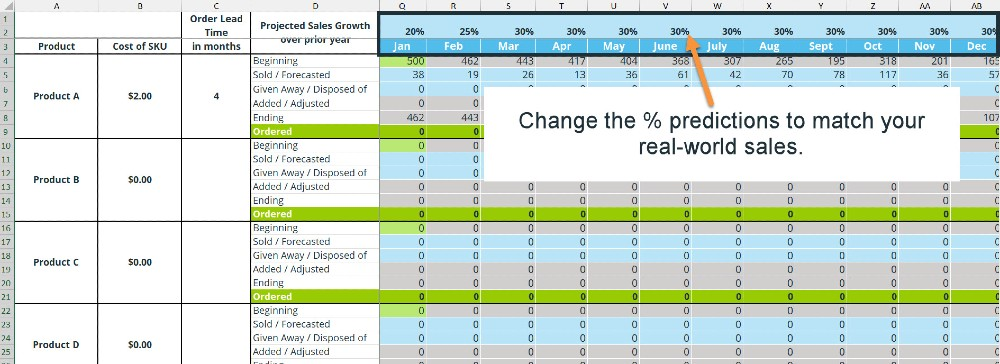
The columns to the right of your “prior year sales data” section will use the data you’ve added to make predictions about your sales for the next year. You’ll have to tweak the % predictions to better match your real-world sales.
Step 2 – The Year Ahead
The section titled “projected sales growth over prior year” is designed to help you make accurate – or at least more accurate – predictions about how your inventory levels are going to change month over month.
Here’s what each row is meant to contain:
- Beginning – The number of products of that SKU you have (or had for the prior year) at the start of the month.
- Sold/ forecasted – How many units you sold OR how many units you expect to sell. Use your prior year data to predict this. Once you reach the end of each month, replace your forecasted figure with the number of units you actually sold.
- Given away/ disposed of – Inevitably some inventory will leave your warehouse without being sold. This might be through marketing, gifts, or damage. Pop those details in this row.
- Ending – How many units are left at the end of the month? Input this data here.
- Ordered – Placed an order? Input this data here to update your inventory overview in the spreadsheet. It uses your lead time column to calculate this.
Further reading: How to Calculate & Optimize Inventory Turnover for eCommerce Sellers
Step 3 – Product Rows
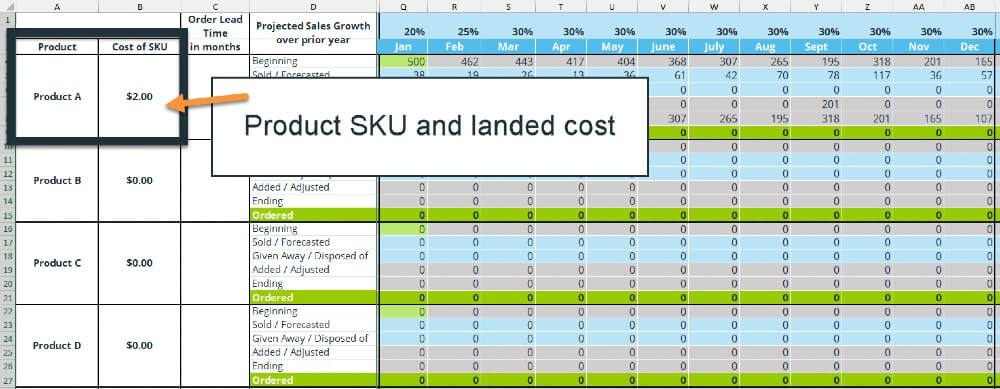
The product rows in our template are where you input data about a given SKU’s name and cost. You can get this figure by looking at what you paid your vendors for each of your products last year. It’s a good idea to add this data if you have it available as the spreadsheet will use it to calculate the cost of your orders.
You may be wondering how to calculate your costs accurately for this. For more information, read: Understanding Landed Cost: What It Is and How to Calculate It.
This gives you a speedy overview of what each of your products costs you per unit.
Note – Want more rows? Follow these steps:
- Select the bottom row, right click, and press copy.
- Right click in the cell directly below your copied cell.
- Click “paste copied cells”
Step 4 – Lead Time Column
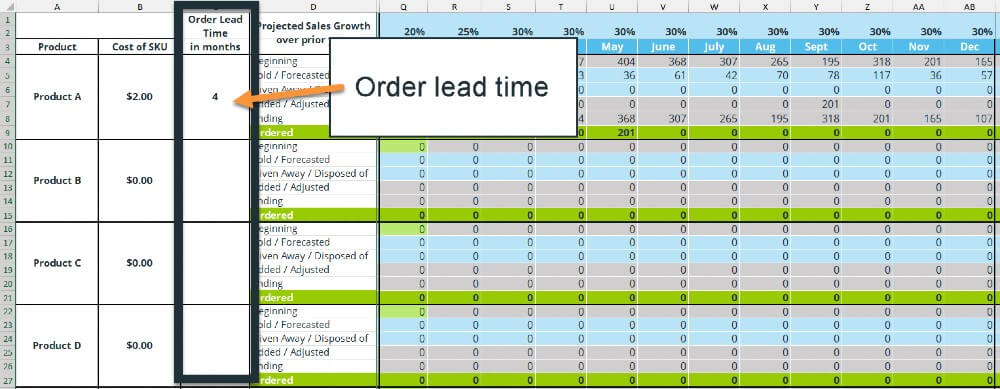
The lead time column is where you input the number of months it usually takes for your orders to arrive. This can help you avoid unnecessary delays.
For example, if you know you’ll need fresh stock of an SKU with a 4-month lead time by June, you should probably place an order around February.
Step 5 – Calculating Order Costs
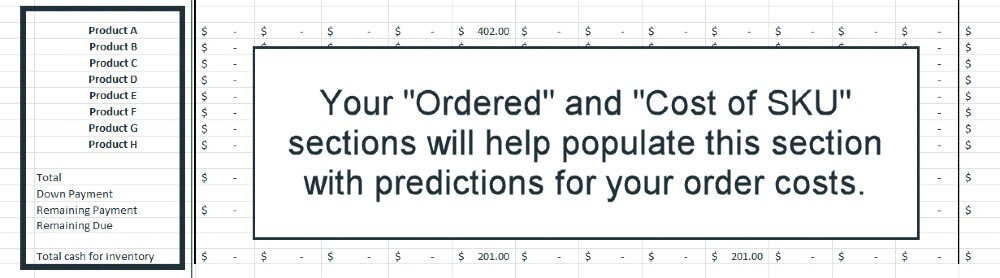
The bottom section of our template is designed to give you a quick overview of how much your orders are likely to cost in a given month. It uses your “cost of SKU” and “ordered” sections to do this.
From our work with our clients, we know that down payments are often a necessary part of ordering, so we’ve included space for this information here.
We’ve also built this spreadsheet on the assumption that each of your SKUs is coming from one vendor. If this isn’t the case for you, the accuracy of this section may serve as an approximation rather than an accurate overview.
Download Your Inventory Forecasting Excel Template Today!
We hope this post has helped you get to grips with how our template works. The best way to learn this approach is to get in and give it a go.
Download your free template here.
Do You Actually Need a Tool, Not Just a Template? We Can Help.
Most accounting topics seem insurmountable at first glance. With the right support and guidance, however, you’ll soon learn that this stuff is doable.
But, if you’d rather stop trying to manage your inventory in a spreadsheet, and you’d rather just pay to have an inventory management tool set up for you, talk to us.
We have a team of dedicated ecommerce inventory experts that have worked with many leading brands to help them manage their inventory more effectively and efficiently.
To learn more about how we help you, too, click here.